
113
Technical Research |Abstracting the Human Systems
112
Technical Research |Abstracting the Human Systems
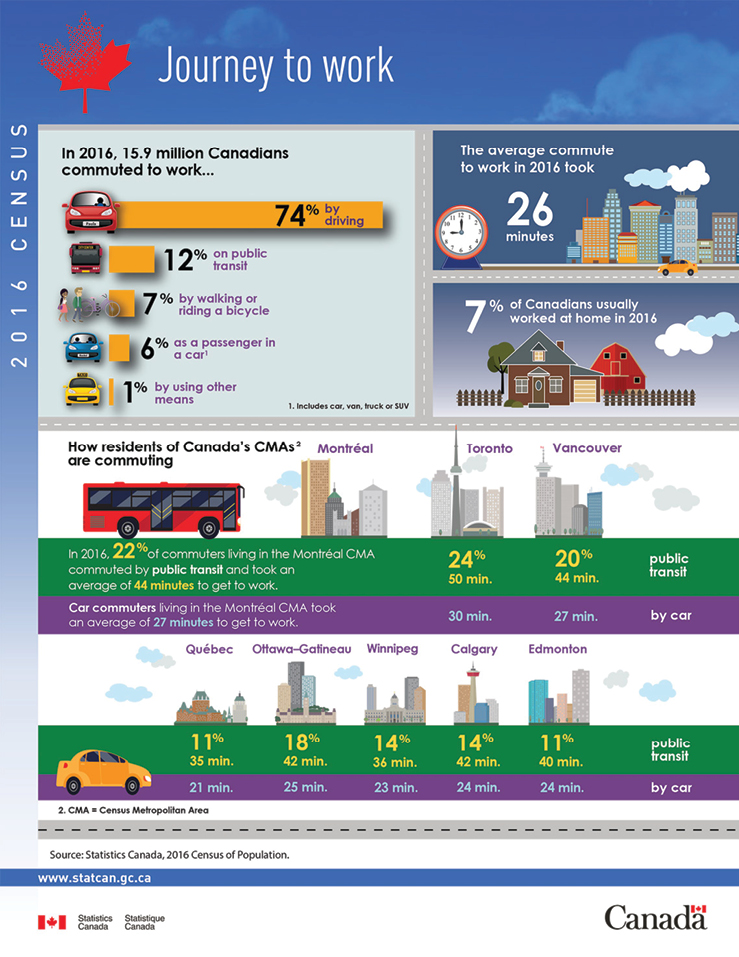
Canadian census info-graphic breaking down the population into percentages
From Statistics Canada, “Journey to Work, 2016 Census of Population,” November 29, 2017, Government of Canada, accessed December 27, 2019, https://www150.statcan.gc.ca/n1/pub/11-627-m/11-627-m2017038-eng.htm.
Decision Logic
After establishing the foundation that is the pathfinding system, the next step is to build upon it by establishing the decision logic system. This system determines how the agents choose their actions within the simulation and is responsible for providing the main steering force of directing where the agents need to go. While the previous section investigated how action selection within locomotion dealt with the subconscious in-the-moment calculations of deciding which way to turn to avoid an upcoming obstacle, this current section will investigate how the decision logic deals with the conscious overall goal of the agent within the space. In doing so, the agents can acquire a sense of objective instead of mindlessly walking around the space.
The first step is to establish the method by which the agents can decide, which at the simplest form, can be defined by a series of logic gates within a decision matrix, composing of yes and no outcomes. These gates are created by utilizing if/else statements within the programming language and can be controlled using probability by generating a number between 0 and 100. This makes it possible to define actions based on percentages, which allows for the injection of non-uniformity with simple inputs. While this method may seem crude in simulating individual human decisions, it is important to remember the complexity that comes with human decisions and acknowledge “there are certain phenomena and events in any environment where we have to consider them as random because we simply have no better way of characterizing them.”[21] The validity of this approach is further supported within Design and Use of Computer Simulation Models, where they state that “most situations in the real world have stochastic (randomly varying) properties because of real (or assumed) ignorance of details. Sometimes these properties must be modeled explicitly, but it is often sufficient to model situations as if they were deterministic by using expected values of the variables.”[22]
Furthermore, the observation that individually can break down in larger crowds means that populations can often be broken down into percentages as well. The Canadian Census is a good example of this concept, in which the population is broken down by categories and numbers. (Fig. 2.3.27) It is shown here that in 2016, Canada had an employment rate of around 61%,[23] with 74% of Canadians driving to work and 12% using public transit.[24] With this, a simple city-sized traffic simulation might be created where each agent would have a 61% chance of going to work, with a 74% chance of using a car and 12% of taking transit. Even with each individual only utilizing one form of transportation, the overall simulation will behave like a collective city. This is in line with Sokolowski and C. Banks’ points, where they stated, “Random event refers to occurring without a recognizable pattern. Random events can be represented by statistical distributions that allow one to simulate these seemingly random occurrences.”[25]

